U.S. total exports of textiles and apparel: Decreased by $3.3 billion (14.8 percent) to $18.9 billion
U.S. domestic exports of textiles and apparel: Decreased by $3.0 billion (17.1 percent) to $14.7 billion
Re-exports decreased by $223 million (5.1 percent) to $4.1 billion
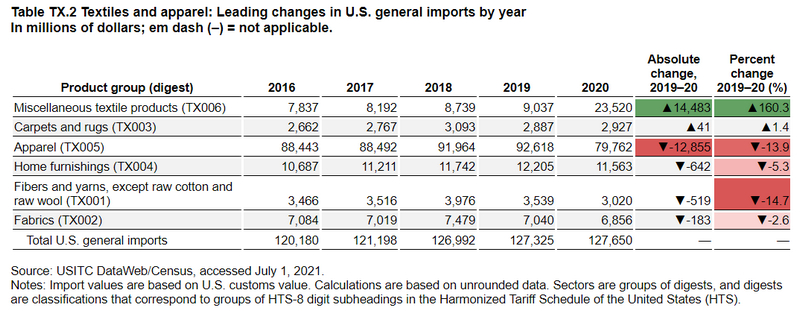
U.S. general imports of textiles and apparel: Increased by $325 million (0.3 percent) to $127.7 billion
The value of U.S. domestic exports of textile and apparel products[1] decreased $3.0 billion (17.1 percent) to $14.7 billion from 2019 to 2020.[2] U.S. textile and apparel exports dropped in all digests. Declines in exports were largest in the fibers and yarns digest, which fell $1.1 billion (25.6 percent) in 2020 (table TX.1), as well as the apparel digest, which dropped $734 million (22.7 percent) in 2020 (table TX.1).
Domestic exports made up $14.7 billion (78.1 percent) of total exports, while re-exports (foreign exports) accounted for the remaining $4.1 billion (21.9 percent). Re-exports decreased by $223 million (5.1 percent). As in previous years, approximately half of total exports in the apparel digest (49.0 percent) were re-exports in 2020, as the United States continues to act as a hub for the distribution of goods for U.S.-based brands and retailers.
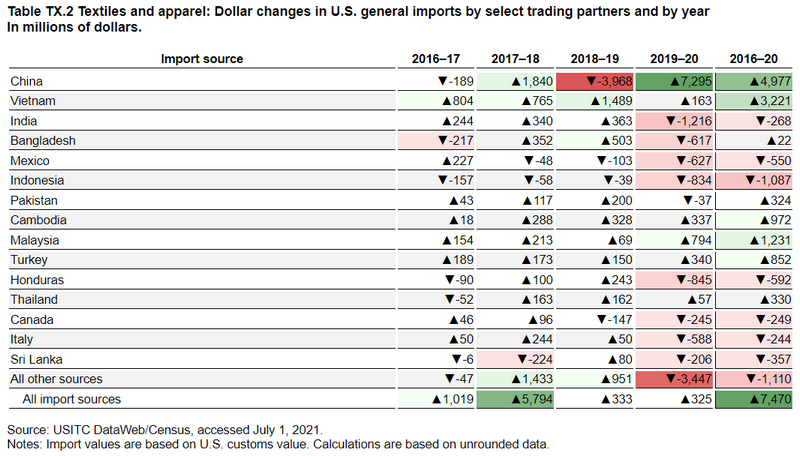
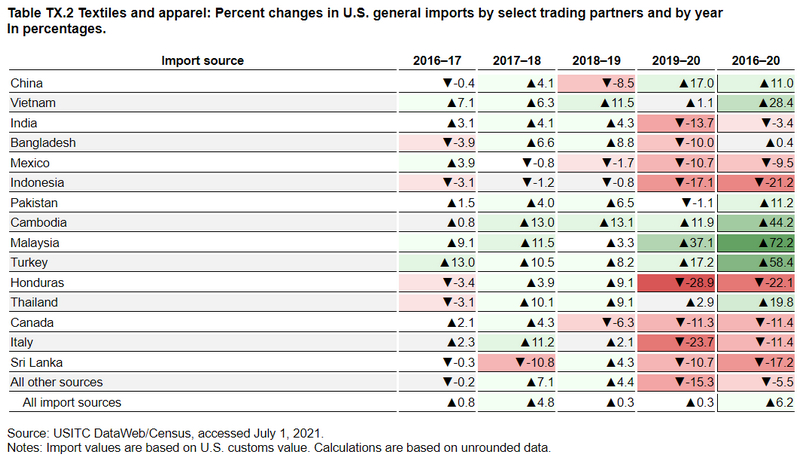
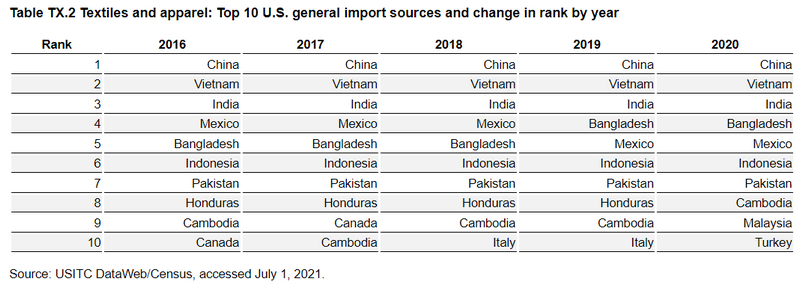
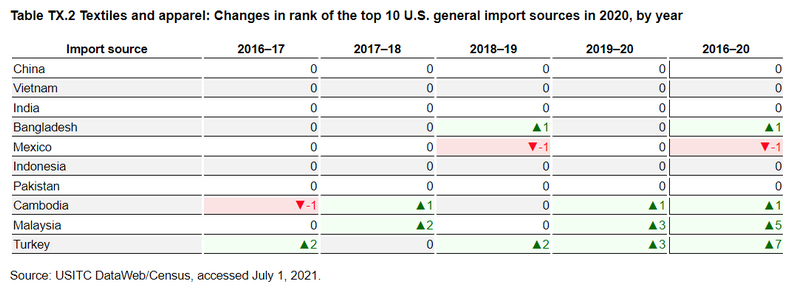
The value of U.S. general imports of textile and apparel products remained relatively unchanged, increasing by just $325 million (0.3 percent) to $127.7 billion in 2020. China was the United States’ largest supplier of textiles and apparel (table TX.1). Imports from China decreased in most digests, primarily led by decreases in imports of apparel, home furnishings, and fibers and yarn; such declines, however, were more than offset by an increase in imports of miscellaneous textile apparel products, attributed to the high demand for face masks used in the COVID-19 pandemic.
U.S. Domestic Exports
Table TX.1 Textiles and apparel: U.S. domestic exports by select trading partners and re-exports and by year
In millions of dollars.
Destination market
2016
2017
2018
2019
2020
Mexico
4,157
4,139
4,367
4,124
3,487
Canada
3,600
3,752
3,702
3,601
3,361
Honduras
1,455
1,497
1,541
1,604
1,011
China
855
851
766
646
641
Dominican Republic
517
544
550
521
402
United Kingdom
465
456
500
475
360
Japan
432
409
423
425
348
Belgium
422
385
382
422
348
Nicaragua
275
326
448
462
324
Netherlands
384
388
348
333
313
El Salvador
367
438
471
438
290
Guatemala
295
294
312
275
275
South Korea
286
282
289
302
250
Germany
260
260
272
290
236
Australia
221
227
224
214
197
All other destination markets
3,671
3,597
3,714
3,625
2,872
U.S. domestic exports to all destination markets
17,662
17,845
18,311
17,757
14,715
Re-exports
4,072
4,300
4,460
4,353
4,130
U.S. total exports
21,734
22,146
22,771
22,110
18,845
Source: USITC DataWeb/Census, accessed July 1, 2021. Notes: Export values are based on free alongside ship value, U.S. port of export. Calculations are based on unrounded data.
U.S. domestic exports in the textile and apparel sector decreased across all digests, with the greatest drop by value and percent seen in fibers and yarns, which fell $1.1 billion (25.6 percent) to $3.2 billion during 2019–20. Fabric exports saw the second-greatest decrease by value, falling $926 million (15.8 percent) to $4.9 billion, yet this digest continues to encompass the largest share of exports of textiles and apparel at 33.4 percent.
The largest factor behind the overall decrease in U.S. exports was the COVID-19 pandemic, which dampened production of traditional textile and apparel goods and led to U.S. production facilities shifting more of their production to personal protective equipment (PPE).[3] This domestically produced PPE was largely consumed within the United States.[4] Thus, the demand for fibers and yarns as well as fabric overall diminished, despite a few specific materials needed for PPE seeing an increase in demand. Low consumer demand for various products in this sector (primarily apparel), coupled with the need for COVID-19 related goods, spurred a shift in production capacity towards the manufacturing of PPE for domestic consumption across countries globally.[5]
Home furnishings saw a decrease of $52 million (10.0 percent) to $468 million in 2020. Some producers in this industry also pivoted to PPE production.[6] Carpet and rug exports fell $166 million (19.9 percent). Under the HTS heading that covers carpets and rugs, the HTS 8-digit subheading that saw the greatest decline in dollar value includes rugs and carpets used for motor vehicle interiors, as well as highly durable fabric for home décor.[7] The decline in those types of rugs and carpets can be partially attributed to an overall decline in motor vehicle production.[8]
Despite overall declines in each digest, there were some digests that experienced growth in certain products. For example, U.S. exports of many nonwoven, laminated, and coated fabrics increased, in 2020.[9] Exports of these fabrics at this magnitude was not seen in previous years and can be attributed to their use for producing PPE. Exports of nonwoven face masks increased by $142 million (40.0 percent), which was the greatest increase by value of any HTS subheading across the textiles and apparel sector.[10]
Mexico and Canada continue to be the largest markets for exports in the textile and apparel sector, accounting for 36.3 percent of the total in 2020. The fabrics, apparel, and miscellaneous textile products digests made up the bulk of U.S. exports to Canada and Mexico, with these two destinations accounting for 55.0 percent of exports of fabrics, 51.6 percent of exports of apparel, and 45.1 percent of exports of miscellaneous textile products. Exports of carpets and rugs to Canada decreased by $72.8 million (13.6 percent). Canada is the largest destination for U.S. exports of carpets and rugs and is the country that saw the largest decline. One cause for the drop in exports to Canada was the decrease in North American auto production at large and the demand for U.S. manufactured carpets for those vehicles.[11] Exports to Mexico decreased $637 million (15.4 percent), continuing an overall declining trend since 2018, with large decreases by value in fibers and yarns, fabrics, and miscellaneous textile products. A three-year decline in exports to Canada continued in 2020. Such exports fell $240 million (6.7 percent), largely due to declines in exports of apparel as well as carpets and rugs. No country in the top 10 destinations for textile and apparel sector exports had a substantial increase in 2020.
U.S. General Imports
Table TX.2 Textiles and apparel: U.S. general imports by select trading partners and by year
In millions of dollars.
Import source
2016
2017
2018
2019
2020
China
45,163
44,974
46,814
42,846
50,141
Vietnam
11,356
12,160
12,925
14,414
14,577
India
7,948
8,193
8,532
8,896
7,680
Bangladesh
5,547
5,330
5,683
6,185
5,569
Mexico
5,792
6,019
5,971
5,868
5,242
Indonesia
5,140
4,983
4,925
4,887
4,053
Pakistan
2,900
2,943
3,061
3,261
3,224
Cambodia
2,199
2,217
2,505
2,833
3,171
Malaysia
1,704
1,859
2,072
2,141
2,935
Turkey
1,460
1,649
1,822
1,972
2,312
Honduras
2,673
2,583
2,683
2,926
2,081
Thailand
1,668
1,616
1,779
1,941
1,998
Canada
2,180
2,226
2,323
2,176
1,931
Italy
2,134
2,183
2,427
2,478
1,890
Sri Lanka
2,079
2,073
1,848
1,928
1,722
All other sources
20,236
20,189
21,622
22,573
19,126
All import sources
120,180
121,198
126,992
127,325
127,650
Source: USITC DataWeb/Census, accessed July 1, 2021. Notes: Import values are based on U.S. customs value. Calculations are based on unrounded data.
The value of U.S. imports in the textile and apparel sector grew slightly, by $325 million (0.3 percent) to $127.7 billion in 2020; within the different digests of textile and apparel, however, there were many large shifts. U.S. imports of textiles and apparel consisted principally of apparel (62.5 percent of total imports), which experienced the largest decrease in value from 2019, falling $12.9 billion (13.9 percent). This is mainly due to consumers not purchasing as much new apparel as they went out less throughout 2020 because of the COVID-19 pandemic.[12] The largest drop in percentage terms occurred in the fibers and yarns digest, dropping 14.7 percent ($519 million).
In contrast, U.S. imports of miscellaneous textile products increased by $14.5 billion (160.3 percent). The substantial increase in miscellaneous textile product imports was driven by the emergence of heavy demand and consumer spending on nonwoven face masks in 2020, which health experts increasingly recommended to guard against transmission of COVID-19.[13] In April 2020, the U.S. Center for Disease Control (CDC) began recommending that U.S. residents wear cloth or fabric face coverings when in public.[14] Due to global shipping disruptions and high demand for PPE, the U.S. Federal Emergency Management Agency (FEMA) established Project Airbridge, which ran from March 29 to June 1, 2020.[15] The more than 100 percent increase of miscellaneous textile product imports in 2020 increased this digest’s share of total sector imports from 7.1 percent in 2019 to 18.4 percent in 2020. The only other digest that saw an increase in imports was carpets and rugs, for which imports grew modestly by $41 million (1.4 percent). The rise in imports of carpets and rugs can partially be attributed to increased home renovations and redecorating undertaken during the height of the pandemic and while people were working from home.[16] However home furnishings saw a decrease in imports by $642 million (5.3 percent) from 2019 to 11.6 billion in 2020. This drop in home furnishing imports was part of the larger overall trend in declining consumer spending.[17]
China is the largest supplier of textiles and apparel to the United States (table TX.2) and its share of U.S. imports in this sector increased to 39.2 percent in 2020 from 33.6 percent in 2019.[18] China’s increase in market share was largely due to its textile exports: the miscellaneous textile products digest had a $12.8 billion (262.3 percent) increase in U.S. imports from China, the largest increase by both value and volume across all textile and apparel digests. The growth was particularly driven by face mask exports that China ramped up in response to the COVID-19 pandemic.[19] Since the pandemic began, China’s face mask exports to the United States increased at least sixfold in value.[20] Moreover, China’s exports to the United States of the meltblown fabric[21] used in mask production also increased, growing 103.2 percent.[22]
China is currently the largest apparel supplier to the United States, accounting for 22.7 percent of total U.S. imports of apparel in 2020. The value of U.S. apparel imports from China decreased by $4.9 billion (17.3 percent) in 2020, the largest decrease by value across digests; this continued a multiyear trend of declines in this digest from China that was exacerbated by the COVID-19 pandemic.[23] U.S. imports of fibers and yarns from China also decreased, dropping by $137.5 million (24.7 percent).
Vietnam was the second-largest supplier of textiles and apparel to the United States in 2020. The value of U.S. imports of textiles and apparel from Vietnam had increased in recent years and increased by $163 million (1.1 percent) to reach $14.6 billion in 2020. Firms have been shifting their sourcing from China to Vietnam and Bangladesh due to a combination of rising costs in China, tariffs imposed on imports from China under section 301 of the Trade Act of 1974, and lower labor costs in Vietnam and Bangladesh.[24] Vietnam, which had a much lower COVID-19 infection rate than other countries in the region, had a small increase in its share of textile and apparel exports to the United States, which grew from 11.3 percent in 2019 to 11.4 percent in 2020.[25] U.S. imports of apparel made up 90.9 percent of total textile and apparel imports from Vietnam in 2020, down $163.5 million (2.2 percent) from 2019 values. U.S. imports of miscellaneous textile products from Vietnam increased $711 million (388.1 percent) in 2020, stemming largely from increased imports of face masks. Vietnam exported nearly 1.2 billion face masks globally in 2020, after lifting export restrictions on such products in March 2020.[26] U.S. imports from Vietnam also saw a large increase in fibers and yarns, $20.4 million (33.4 percent).
Although their market share decreased in 2020, India, Bangladesh, and Mexico continued to be the third-, fourth-, and fifth-largest suppliers, respectively, to the United States in the textile and apparel sector in 2020. U.S. imports from India decreased $1.2 billion (13.7 percent) to reach $7.7 billion, led by a $1.1 billion (24.6 percent) decline in the imports of apparel. Imports from India were largely made up of apparel (35.6 percent). Imports from India in most textile and apparel digests decreased, except for fabrics, imports of which grew $25.9 million (4.4 percent). Imports from Bangladesh fell $617 million (10.0 percent) caused predominantly by a $657.1 million decline in imports of apparel (11.0 percent), the largest decrease by value. However, imports from Bangladesh of miscellaneous textile products increased by $41.1 million (27.5 percent). Imports from Mexico decreased by $627 million (10.7 percent) in 2020, as imports across almost all digests fell. The exception was imports in the miscellaneous textile products digest, which grew by $279 million (26.5 percent); this rise was largely due to face mask imports.[27]
References:
[1] The Textiles and Apparel sector consists of six product digests. Each USITC sector digest encompasses various 8-digit subheadings in the Harmonized Tariff Schedule of the United States (HTS). For a complete list of HTS subheadings classified in a particular sector or digest, see this data table.
[2] Except where otherwise noted, the export data used in this section are for domestic exports. For more information on trade terminology, please refer to USITC, “Special Topic: Trade Metrics,” Shifts in U.S. Merchandise Trade, 2014, June 2015.
[3] Davis, “COVID-19: The Textile Industry Responds,” May 27, 2020. Wright, “Cotton, Textile Sectors Call for Collaborative Action amid Covid-19,” May 15, 2020.
[4] Georgi, Alberda, and Costelloe, “Reference Guide: Worldwide Export Controls on Face Masks,” June 3, 2020.
[5] Pineau, “French Mask Producers Seek Protective Shield Once Pandemic Over,” February 8, 2021; Rees, “UK Set to Produce 70 Percent of PPE Required Domestically by December,” September 29, 2020; USITC, COVID-19 Related Goods, December 2020, 91–93, 105, 117–119; Wilson, “Robust Response to PPE Shortages in Germany,” July 20, 2020.
[6] Maidenberg, “Small Manufacturers Pivot to Making Simple Masks,” April 7, 2020.
[7] USITC DataWeb/Census, HTS subheading 5703.20.20, accessed July 1, 2021.
[8] For more details regarding automotive production, see the Transportation Equipment section of this report.
[9] USITC DataWeb/Census, digest TX002, accessed July 1, 2021.
[10] USITC DataWeb/Census, HTS subheading 6307.90.98, accessed July 1, 2021.
[11] Trade Data Information Services Inc., Import Genius database, accessed July 1, 2021.
[12] Howland, “The Naked Truth about Apparel’s Future,” October 22, 2020; Kohan, “Apparel and Accessories Suffer a Catastrophic 52% Sales Decline in March,” April 16, 2020.
[13] Feng, “COVID-19 Has Caused A Shortage of Face Masks,” May 16, 2020.
[14] Dwyer and Aubrey, “CDC Now Recommends Americans,” April 3, 2020.
[15] For more information on the shipping disruptions, see the Special Focus section in this report; FEMA, “FEMA Phasing Out Project Airbridge,” June 18, 2020.
[16] Herlihy, “Future Looks Bright for Carpet,” February 25, 2021.
[17] Felix and Shampine, “Consumer Spending Declines,” February 17, 2021.
[18] The last time China held 39 percent of the U.S. textile and apparel sector was 2014.
[19] During 2020, China increased its face mask production 12-fold and increased its meltblown fabric production fivefold. See Roberts, “China More Dominant Than Ever in Covid-Related ‘PPE’,” September 19, 2020.
[20] USITC DataWeb/Census, HTS statistical reporting numbers 6307.90.9889 (only used for January 2020 through June 2020), 6307.90.9845, 6307.90.9870, and 6307.90.9875 (used for July through December 2020), accessed July 1, 2021; face masks received a separate HTS breakout in July 2020. Prior to that, face masks, in addition to other products, were classified under statistical reporting number 6307.90.9889.
[21] Meltblown fabric is melted polypropylene made into a webbed fabric with various thickness depending on the filtration level required for the final good. N95 face masks and surgical masks are made using meltblown fabric.
[22] USITC DataWeb/Census, HTS subheadings 5603.11 and 5603.12, accessed July 1, 2021.
[23] Russell, “China Sees US Apparel Imports Slip in 2020 for Third Year,” February 8, 2021.
[24] Mandhana, “Manufacturers Want to Quit China for Vietnam,” August 21, 2019; Zwirn, “US Brands Ponder Sourcing Switch,” November 13, 2018.
[25] Between April 20, 2020 and July 20, 2020, Vietnam had no reported locally transmitted cases of COVID-19 and no reported deaths caused by COVID-19. Malhotra, “The Key to Viet Nam’s Successful COVID-19 Response,” August 29, 2020.
[26] Davis, “Vietnam’s Textile Industry Combats Pandemic with PPE Switch,” accessed May 24, 2021.
[27] Rose, “Why Can’t America Make Enough N95 Masks?,” September 17, 2020.
Bibliography — Textiles and Apparel
Bradsher, Keith. “China Dominates Medical Supplies, in This Outbreak and the Next.” The New York Times, July 5, 2020, sec. Business. https://www.nytimes.com/2020/07/05/business/china-medical-supplies.html.
Davis, Brett. “Vietnam’s Textile Industry Combats Pandemic with PPE Switch.” Forbes, March 24, 2021. https://www.forbes.com/sites/davisbrett/2021/03/24/vietnams-textile-industry-combats-pandemic-with-ppe-switch/.
Davis, Rachael. “COVID-19: The Textile Industry Responds to PPE Shortage.” Textile World, May 27, 2020. https://www.textileworld.com/textile-world/features/2020/05/covid-19-the-textile-industry-responds-to-ppe-shortage/.
Dwyer, Colin, and Allison Aubrey. “CDC Now Recommends Americans Consider Wearing Cloth Face Coverings in Public.” NPR, April 3, 2020. https://www.npr.org/sections/coronavirus-live-updates/2020/04/03/826219824/president-trump-says-cdc-now-recommends-americans-wear-cloth-masks-in-public.
Felix, Alison, and Samantha Shampine. “Consumer Spending Declines, Shifts in Response to the Pandemic.” Federal Reserve Bank of Kansas City, February 17, 2021. https://www.kansascityfed.org/research/economic-bulletin/consumer-spending-declines-shifts-in-response-to-the-pandemic/.
Feng, Emily. “COVID-19 Has Caused a Shortage of Face Masks. But They’re Surprisingly Hard to Make.” NPR, May 16, 2020. https://www.npr.org/sections/goatsandsoda/2020/03/16/814929294/covid-19-has-caused-a-shortage-of-face-masks-but-theyre-surprisingly-hard-to-mak.
Georgi, Kay C., Regan K. Alberda, and Sylvia G. Costelloe. “Reference Guide: Worldwide Export Controls on Face Masks and Other Medical Personal Protective Equipment.” Arent Fox, June 3, 2020. https://www.arentfox.com/perspectives/alerts/reference-guide-worldwide-export-controls-face-masks-and-other-medical-personal.
Herlihy, Janet. “Future Looks Bright for Carpet in New Home Market.” Floor Covering Weekly, February 25, 2021. https://www.floorcoveringweekly.com/main/topnews/future-looks-bright-for-carpet-in-new-home-market-33233.
Howland, Daphne. “The Naked Truth about Apparel’s Future.” Retail Dive, October 22, 2020. https://www.retaildive.com/news/the-naked-truth-about-apparels-future/587395/.
Maidenberg, Micah. “Small Manufacturers Pivot to Making Simple Masks.” The Wall Street Journal, April 7, 2020, sec. Business. https://www.wsj.com/articles/small-manufacturers-pivot-to-making-simple-masks-11586264401.
Malhotra, Kamal. “The Key to Viet Nam’s Successful COVID-19 Response: A UN Resident Coordinator Blog.” UN News (blog), August 29, 2020. https://news.un.org/en/story/2020/08/1070852.
Mandhana, Niharika. “Manufacturers Want to Quit China for Vietnam. They’re Finding It Impossible.” The Wall Street Journal, August 21, 2019, sec. Business. https://www.wsj.com/articles/for-manufacturers-in-china-breaking-up-is-hard-to-do-11566397989.
McKay, Rich. “‘Laser-Focused’ on Surgical Masks, U.S. Textile Firms Pivot in Coronavirus Pandemic.” Reuters, March 23, 2020. https://www.reuters.com/article/us-health-coronavirus-usa-textiles-idUSKBN21A3L3.
Passy, Jacob. “‘Pretty Much Everyone Has Them on Sale’: The Nationwide Obsession with Buying Face Masks Is Over.” MarketWatch, May 25, 2021. https://www.marketwatch.com/story/pretty-much-everyone-has-them-on-sale-as-sales-drop-the-nationwide-rush-to-buy-face-masks-is-finally-over-11621876242.
Pineau, Elizabeth. “French Mask Producers Seek Protective Shield Once Pandemic Over.” Reuters, February 8, 2021. https://www.reuters.com/article/us-health-coronavirus-france-masks-idUSKBN2A8114.
Rees, Victoria. “UK Set to Produce 70 Percent of PPE Required Domestically by December.” European Pharmaceutical Review, September 29, 2020. https://www.europeanpharmaceuticalreview.com/news/129369/uk-set-to-produce-70-percent-of-ppe-required-domestically-by-december/.
Roberts, Ken. “China More Dominant Than Ever in Covid-Related ‘PPE’—And U.S. Flags.” Forbes, September 19, 2020. https://www.forbes.com/sites/kenroberts/2020/09/19/china-more-dominant-than-ever-in-covid-related-ppe—and-us-flags/.
Rose, Joel. “Why Can’t America Make Enough N95 Masks? 6 Months into Pandemic, Shortages Persist.” Coronavirus Crisis. NPR, September 17, 2020. https://www.npr.org/2020/09/17/913093387/why-cant-america-make-enough-n95-masks-6-months-into-pandemic-shortages-persist.
Russell, Michelle. “China Sees US Apparel Imports Slip in 2020 for Third Year.” Just-Style, February 8, 2021. https://www.just-style.com/analysis/china-sees-us-apparel-imports-slip-in-2020-for-third-year_id140673.aspx.
Trade Data Information Services, Inc. Import Genius database. Accessed June 28, 2021. https://www.importgenius.com/
U.S. Federal Emergency Management Agency (FEMA). “FEMA Phasing Out Project Airbridge,” June 18, 2020. https://www.fema.gov/press-release/20210318/fema-phasing-out-project-airbridge.
U.S. International Trade Commission (USITC). COVID-19 Related Goods: The U.S. Industry, Market, Trade, and Supply Chain Challenges. Investigation No. 332-580. USITC Publication 5145. Washington, DC: USITC, December 2020. https://usitc.gov/sites/default/files/publications/332/pub5145.pdf.
U.S. International Trade Commission (USITC) Interactive Tariff and Trade DataWeb (DataWeb)/U.S. Department of Commerce (USDOC). http://dataweb.usitc.gov (accessed various dates).
U.S. International Trade Commission (USITC). “Special Topic: Trade Metrics,” Shifts in U.S. Merchandise Trade, 2014. Investigation No. 332-345. USITC Publication 4536. Washington, DC: USITC, June 2015. https://www.usitc.gov/research_and_analysis/trade_shifts_2014/trade_metrics.htm.
Wilson, Adrian. “Robust Response to PPE Shortages in Germany.” Innovation in Textiles, July 20, 2020. https://www.innovationintextiles.com/nonwovens/.
Wright, Beth. “US Apparel Imports Tumble by More Than One-fifth in May.” Just Style, July 3, 2020. https://www.just-style.com/analysis/us-apparel-imports-tumble-by-more-than-one-fifth-in-may_id139099.aspx.
Wright, Beth. “Cotton, Textile Sectors Call for Collaborative Action Amid Covid-19.” Just Style, May 15, 2020. https://www.just-style.com/news/cotton-textile-sectors-call-for-collaborative-action-amid-covid-19/.
Zwirn, Ed. “US Brands Ponder Sourcing Switch Away from China.” Just Style, November 13, 2018. https://www.just-style.com/analysis/us-brands-ponder-sourcing-switch-away-from-china_id134987.aspx.


 portal")


