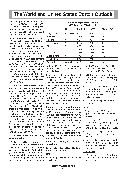
                                The World and United States Cotton Outlook
cated that producers intend to mod-
estly reduce ELS cotton area in 2020.
USDA’s first survey of producer plant-
ing intentions - Prospective Plantings
- will be conducted in early March and
published on March 31, 2020.
For the purposes of this analysis, cot-
ton plantings of 12.5 million acres are
estimated to result in harvested acre-
age of about 11.0 million acres, 7 per-
cent below 2019. The projected national
abandonment rate of approximately
12.5 percent is based on regional long-
run averages, with the exception of the
Southwest, where 2020 abandonment
is projected at 19 percent—down from
23 percent in 2019. Southwest aban-
donment rates are highly variable and
conditions there will have a consider-
able impact on the U.S. crop. The lat-
est NOAA seasonal outlook for the
Southwest indicates that drought is not
forecast to be an issue through at least
the end of April.
USDA is forecasting a national aver-
age yield - based on regional average
yields - of 855 pounds per harvested
acre, up from the 2019 yield of 817
pounds. The 2020 U.S. cotton crop is
projected at 19.5 million bales, 3 per-
cent (600,000 bales) below 2019, as a
rebound in the U.S. yield offsets much
of the area reduction in 2020. Smaller
crops are anticipated for most of the
Cotton Belt, with the exception of the
Southwest, where 2020 cotton produc-
tion could rise to its second highest
on record. Based on higher U.S. carry-
in stocks of 5.4 million bales for 2020/
21 but lower production, the total sup-
ply - 24.9 million bales - would nearly
match that from 2019/20, which was
the highest since 2007/08.
U.S. Disappearance, Ending Stocks,
and Farm Price
U.S. domestic mill use is projected at
3.0 million bales, essentially un-
changed from 2019/20, due to contin-
ued import competition and moderate
growth in domestic demand. U.S. cot-
ton mill use will also be sustained by a
rebound in semi-processed textile and
apparel exports—mainly to MexicoU.S. Cotton Supply and Demand
2019/20 est. and 2020/21 proj.
Unit2019/202020/21Change (%)
Beg. Stocks
ProductionMil. bales
"4.85
20.105.40
19.5011.3
3.0
Imports
Total supply"
"0.01
24.960.01
24.910.0
-0.2
Mill use
Exports"
"3.00
16.503.00
16.500.0
0.0
Total use
Ending stocks"
"19.50
5.4019.50
5.300.0
-1.9
Stocks-to-use
Farm price%
cents/lb.27.7
62.027.2
64.0-1.8
3.2
and the CAFTA-DR/CBI countries—
that are finished and shipped back to
the United States.•894,000 metric tons (MT) TRQ at
1% duty; calendar year basis, one-
third reserved for State Enterprises.
Exports are projected unchanged at
16.5 million bales, reflecting in part the
stability of U.S. exportable supply.
China’s rising imports and easing U.S.-
China trade tensions are favorable for
U.S. exports to some degree, but Bra-
zilian exports are expected to remain
near record levels and the United
States will face additional competition
early in the season as India’s remain-
ing priceintervention stocks become
available to world markets.•Sliding scale impor t licenses,
800,000 MT issued; valid Sept/18-
Feb/19, but licenses were not fully
used.
•Imports of U.S. cotton faced addi-
tional 25% duty starting in June;
some imports by State Enterprises
and for processing exempt from
additional duties.
•Imports of foreign cotton by State
Reserve.
Ending stocks are projected to decline
slightly, their first decline in 4 years.
At 5.3 million bales, U.S. ending stocks
in 2020/21 are expected to be 100,000
bales lower than during the year be-
fore. Reduced stocks in the United
States and in other countries outside
of China are expected to reduce pres-
sure on cotton prices in 2020/21, and
the average price received by produc-
ers could rise to 64 cents per pound,
compared with the 2019/20 current fore-
cast of 62 cents.2019
China Cotton Policy and USDA As-
sumptions• Out-of-quota duty, TRQ, and duty-free
processing imports same as previ-
ous year.
•Imports of U.S. cotton face addi-
tional 25% duty; some imports by
State Enterprises and for process-
ing exempt from additional duties.
•Imports of foreign cotton by State
Reserve, but U.S. imports ex-
cluded.
•Additional access provided; addi-
tional Sliding Scale quota of
800,000 tons issued, but licenses
were not fully used.Import Policy: Sliding Scale Quota Is-
sued Starting in 2018
2020 & 2021
2018
•
•Out-of-quota import duty is 40% ad
valorem.
NCM-MARCH 2020
31Out-of-quota duty, TRQ, and duty-
free processing imports same as
previous year.