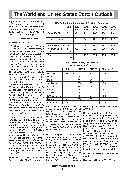
                                The World and United States Cotton Outlook
larger exports. Stocks outside of China
are forecast up 9 percent and at a record
of 48.4 million bales. China stocks (in-
cluding State Reserve) are projected
at 33.7 million bales, down nearly 2
million from the previous year.
U.S. Cotton Situation, 2019/20U.S. Cotton Area, Abandonment, Yield, and Production
Unit2015/
20162016/
20172017/
20182018/
20192019/
2020
Planted acresmil.
acres8.610.112.714.113.7
Harvested acresmil.
acres8.19.511.110.211.8
Abandonment rate%5.95.612.727.614.1
Yield/harvested
acrelbs./
acre766867905864817
Productionmil.
bales12.917.220.918.420.1Area and Production
U.S. all-cotton production in 2019/20
is estimated at 20.1 million bales, 9
percent above last season’s crop. Al-
though 2019 planted area was slightly
below the previous year, harvested area
increased. Cotton planted acreage in
2019 - at 13.7 million acres - decreased
less than 3 percent, as relative prices
slightly favored alternative crops over
cotton. Planted area to cotton was the
second highest during the last 7 years.
The U.S. abandonment rate declined
to 14 percent in 2019 - nearly half the
level of 2018 - as harvested area
reached 11.8 million acres, the high-
est since 2006. Meanwhile, the U.S.
2019 yield declined from last season’s
864 pounds per harvested acre to 817
pounds. Upland production is estimated
at nearly 19.4 million bales - 1.8 mil-
lion above 2018 - with an average yield
of 803 pounds per harvested acre,
compared with the 5-year average of
835 pounds. Extra-long staple (ELS)
cotton production is estimated 10 per-
cent lower - at 722,000 bales - due to
lower area in 2019.
Compared with last season, 2019 up-
land cotton production was larger in
three of the four Cotton Belt regions.
Upland cotton production decreased
only in the Southwest in 2019, declin-
ing over 500,000 bales to 7.3 million
bales, the lowest in 4 years. The South-
west accounted for only 38 percent of
total U.S. upland production, the small-
est share since 2013. While Southwest
abandonment reached 23 percent -
slightly above the 5-year average - the
yield decreased dramatically to 583
pounds per harvested acre, the lowest
since 2003.
Southeast cotton production increased
34 percent in 2019 to 5.7 million bales,U.S. Cotton Supply and Demand
2018/19 and 2019/20 est.
Unit2018/192019/20Change (%)
Beg. Stocks
ProductionMil. bales
"4.2
18.44.9
20.115.5
9.4
Imports
Total supply"
"0.0
22.60.0
25.00.0
10.6
Mill use
Exports
Total use"
"
"3.0
14.8
17.73.0
16.5
19.50.8
11.8
9.9
Ending stocks
Stocks-to-use"
%4.9
27.35.4
27.711.3
1.5
Farm pricecents/lb.70.362.0-11.8
the largest crop since 2012, as pro-
duction rebounded from the effects of
two hurricanes in 2018. Planted area
in 2019 increased for the third consecu-
tive year to nearly 3.0 million acres -
the highest since 2011 - as some area
shifted from soybeans. In addition, the
Southeast yield reached 932 pounds
per harvested acre in 2019, the third
highest on record.
Delta cotton production in 2019 rose
18 percent from the previous year to
nearly 5.6 million bales, or 29 percent
of the total U.S. upland production.
Planted area reached 2.4 million
acres, the highest since 2011; with
average abandonment, harvested area
was also the highest in 8 years. The
Delta yield reached 1,134 pounds per
harvested acre in 2019 - slightly be-
low the 2018 record-contributing to a
NCM-MARCH 2020
26Delta crop that reached its highest
since 2006.
Upland planted area in the West de-
creased in 2019, but production rose
due to a higher yield. In the West, 2019
upland area totaled 278,000 acres,
compared with 285,000 acres in 2018.
However, the region’s yield of 1,464
pounds per harvested acre - the West’s
highest yield in 3 years- increased up-
land production 7 percent above 2018
to 790,000 bales. ELS cotton area in
the West was also lower in 2019, but a
lower yield reduced ELS production for
the region to 703,000 bales. Neverthe-
less, all cotton production in the West
totaled 1.5 mn bales, similar to 2018.
Domestic Mill Use & Consumer De-
mand
U.S. cotton mill use for 2019/20 is fore-