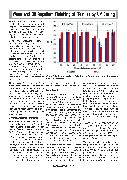
                                Water and Oil Repellent Finishing of Textiles by UV Curing
The high efficiency of Oleophobol, re-
gardless the application method and
the process parameters chosen for the
finishing, is clear. Oleophobol can act
both as water and oil repellent finish-
ing, as confirmed by absorption times
of both drops higher than 120 min.
Considering Pymasil, the repellent ef-
fect was observed only on water drops,
as expected, due to the absence of flu-
orinated chains on the oligomer mole-
cules, which are responsible for the oil
repellency. Silicone chains can confer
good water repellency: The higher ab-
sorption time for a water drop was in
fact 80–90 min. However, better results
were obtained with Oleophobol due to
its greater efficacy as repellent agent,
while Pymasil is not a specific water
repellent finishing, but a softener that
can confer some water repellency
thanks to the silicone component of
its formulation.
The tests with Pymasil were useful to
put in evidence the influence of the fin-
ishing method: better results were ob-
tained by UV radiation, rather than ther-
mal process. When the finishing agent
was applied by UV curing, the water
drop stays unadsorbed on the treated
surface for more than twice as long as
the thermal treated samples. This can
be ascribed to a stronger bond between
the finishing agent and the fibers, due
to grafting reactions induced by ultra-
violet radiation.
Contact Angle Measurements
The CA measured on all treated sam-
ples clearly showed the effect of the
finishing agent: Values near or higher
o
than 150 were always obtained, with
both water and oil, in the case of fluo-
rocarbon finishing, while similar water
CA were measured on samples treat-
ed by the silicone-based product, re-
gardless the fabric considered. These
values, typical of surfaces with super-
repellency showing the so-called “lo-
tus effect”, have to be compared with
o
a 0 CA measured on untreated sam-
ples with both water and oil, due to in-
stantaneous absorption of the drop.
Nevertheless, the influence of the pro-Figure 6: Water and oil CA on PM fabric vs. Oleophobol concentrations for
each UV irradiance.
cess parameters was quite different
considering the two finishing agents.
Oleophobol
The results of water and oil CA on PM
fabric vs. Oleophobol concentrations
for each UV irradiance value are plot-
ted in Figure 6. The averaged determi-
nations on triplicate samples for each
process are shown together with the
error bars based on standard deviation.
However, this type of graphical repre-
sentation can show the dependence of
CA on two process parameters only
for a single substrate. Instead, to jointly
evaluate the influence of fabric type,
finishing concentration, and UV irradi-
ance, the Matrix Plot was drawn by
Minitab 16 and depicted in Supplemen-
tary Material (Figure S1). A matrix plot
is a graph enabling assessment of the
relationship among several pairs of
variables at the same time.
The substrate was found to be the more
influencing parameter, in particular on
water CA. This result was confirmed
even by the analysis of variance (ANO-
VA). The best results were obtained on
VIS while the lowest repellency was
conferred to PM fabric. The chemical
NCM-APRIL 2020
71composition of these textiles is quite
similar, so the different behavior could
be due to the differences in color, tex-
ture, and weight. On the contrary, the
substrate unaffected the conferred oil
repellency, which slightly increased ap-
plying the product at higher concen-
tration. Of low importance was the in-
fluence of product concentration and
irradiance: A slight increase in oil and
water repellency was found with the
lower concentration, while the increase
of the contact angles due to an in-
creased lamp irradiance was negligi-
ble.
The majority of CA measurements was
arranged at higher values: On a total
of 81 measurements, just 17 were low-
o
er than 160 (10 for water and 7 for
o
oil), but never lower than 150 , con-
firming the super oil and water repel-
lency conferred.
Then, the statistical analysis was fur-
ther performed drawing an Interaction
Plot referred to water repellency (Fig-
ure S2 in Supplementary Material). This
plot enables visualization of possible
interactions when the effect of one fac-
tor depends on the level of an another
factor. The means for the levels of one