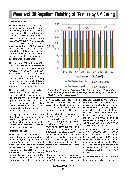
                                Water and Oil Repellent Finishing of Textiles by UV Curing
Color Evaluation
Measurements of DE on differently
treated samples showed that the ef-
fect of both yellowing or color chang-
es are minimal with respect to untreat-
ed samples considered as references.
In fact, in the Marginal Plot reported in
Figure S8 in Supplementary Materials,
a Gaussian distribution of DE values
was observed for all 180 measure-
ments, with most of the samples be-
tween 0.7 and 1.5 and only one sam-
ple with the greatest value of 3.6. More-
over, the color difference was mainly
due to changes in yellowness.
The evaluation of Main effect plot (Fig-
ure S9 in Supplementary Materials)
highlighted the type of fabric as the
more sensitive parameter: On PM neg-
ligible color differences were measured
regardless the process parameters,
while a great influence of the curing
method was revealed on VIS. This can
be due to the different texture of the
samples, as well as their color.
The thermal curing gave lower yellow-
ing on VIS, while on PM and COT best
results were obtained by UV. Moreover,
the substrate color was more affected
by Pymasil rather than Oleophobol.
Finally, the influence of the product
concentration was clear on COT fab-
rics, due to the higher absorption prop-
erties of the same.
By coupling the results reported in the
Main effect plot (Figure S9) and Inter-
action Plot (Figure S10 in Supplemen-
tary Materials), something about the
influence of the different process pa-
rameters can be deduced.
Finishing Process
The Main effect plot shows a little dif-
ference between the two methods,
thermal or UV, with respect to the sam-
ple color. Samples treated by thermal
process seem to keep the final color
more similar to the original, if compared
with UV treated samples. However, a
lower number of samples were finished
by thermal process rather than by UV;
the color difference measurements car-
ried out on thermal treated samplesFigure 8: Water and oil CA on each fabric vs. irradiance. Comparison
between fresly prepared and aged samples (two years) UV treated with
20 g/L Oleophobol concentration.
were homogeneously dispersed be-
tween 0.13 and 3.28 values. It means
that the thermal method does not en-
sure a lower impact on the fabric ap-
pearance with respect to UV process.
The Interaction Plot, in fact, shows how
better results related to thermal treat-
ment are obtained with Oleophobol, but
it is the finishing product giving best
results at all. The main effect was
found related to the substrate: on the
dark PM both treatments can be con-
sidered similar, while on white COT the
thermal process causes a higher color
difference, mainly due to yellowing. On
VIS there is a stronger effect of the
radiation, due to the thin fiber diame-
ter and larger opening of the fabric tex-
ture.
Fabric Type
The fabric type was the most influenc-
ing parameter on color differences due
to the finishing process. A certain ef-
NCM-APRIL 2020
73fect was revealed on COT and VIS,
while on PM the color differences were
negligible. It can be due to the fabric
color (black is less sensitive) or gram-
mage, which is higher for PM. More-
over, color differences measured on
PM are less dispersed and close to
the value 1, while on COT and VIS the
values are more dispersed. For VIS,
values lower than 1 were registered on
all the thermal treated samples.
From the Interaction Plot, besides the
different behavior due to the finishing
method, no influence was evidenced
by the finishing product. Moreover,
considering the UV method, it can be
noted that the influence of the differ-
ent irradiance was quite ineffective on
PM and COT, while for VIS the color
degradation was higher for higher UV
irradiance.
Finishing Product & Concentration
From the Main effect plot it is clear that