The Prosperity Index of the Chinese Textile and Garment Professionals Rises in April
The “Prosperity Index of Textile and Apparel Market” consists of two parts: “manager index” and “merchant index”. The prosperity monitoring results of the China Textile Federation Circulation Branch show that in April 2023, the prosperity index of the national textile and clothing professional market managers was 53.39, an increase of 3.39 percentage points from 50.00 in March; the prosperity index of professional market merchants was 52.99, which was 50.68 compared with March. An increase of 2.31 percentage points.
The prosperity of managers and merchants is on the rise
The data shows that in April, the prosperity index of the national textile and clothing professional market managers and the prosperity index of merchants rose.
The prosperity index of managers rose by 3.39 percentage points
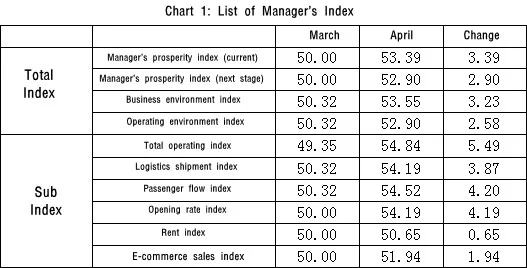
From the perspective of the managers’ prosperity index, among the general indexes, the manager’s prosperity index in April was 53.39, an increase of 3.39 percentage points from 50.00 in March; the business environment index was 53.55, an increase of 3.23 percentage points from 50.32 in March.
Among the sub-indices, the total business index was 54.84, an increase of 5.49 percentage points from 49.35 in March; the logistics shipment index was 54.19, an increase of 3.87 percentage points from 50.32 in March; the passenger flow index was 54.52, an increase from 50.32 in March 4.20 percentage points; the opening rate index was 54.19, an increase of 4.19 percentage points from 50.00 in March; the rent index was 50.65, an increase of 0.65 percentage points from 50.00 in March; the e-commerce sales index was 51.94, an increase of 1.94 percentage points from 50.00 in March percentage point.
The business climate index rose by 2.31 percentage points
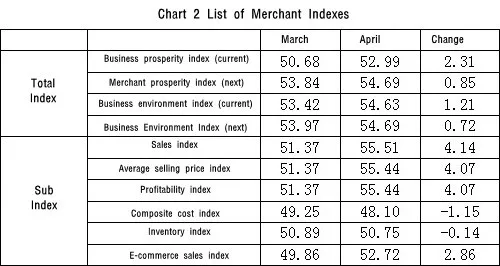
In terms of the business climate index, among the general index, the business climate index in April was 52.99, an increase of 2.31 percentage points from 50.68 in March; the business environment index was 54.63, an increase of 1.21 percentage points from 53.42 in March.
Among the sub-indices, the sales volume index was 55.51, an increase of 4.14 percentage points from 51.37 in March; the average selling price index was 55.44, an increase of 4.07 percentage points from 51.37 in March; the profit index was 55.44, an increase of 4.07 percentage points from 51.37 in March percentage points; the comprehensive cost index was 48.10, a decrease of 1.15 percentage points from 49.25 in March; the inventory index was 50.75, a decrease of 0.14 percentage points from 50.89 in March; the e-commerce sales index was 52.72, an increase of 2.86 percentage points from 49.86 in March .
Data Analysis
The total market operation and logistics shipment volume index increased
In April, 51.61% of the total operating volume of the selected market increased, 51.61 percentage points higher than in March; 45.16% of the logistics shipments of the selected market increased, 38.71 percentage points higher than in March, which shows the operating conditions of the professional market in April increased compared to March.
The total sales volume and profit index of merchants increased
In April, 55.10% of selected merchants’ total sales increased, 37.29 percentage points higher than March; 54.42% of selected merchants’ profits increased, 36.61 percentage points higher than March. improved compared to.
Prediction index
The data shows that in terms of managers, the manager’s prosperity index in the next period is 52.90, an increase of 2.90 percentage points from 50.00 in March; the next business environment index is 52.90, an increase of 2.58 percentage points from 50.32 in March. In terms of merchants, the business climate index for the next issue is 54.69, an increase of 0.85 percentage points from 53.84 in March; the business environment index for the next issue is 54.69, an increase of 0.72 percentage points from 53.97 in March.
Monitoring method
The “Prosperity Index of Textile and Apparel Market” consists of two parts: “manager index” and “merchant index”. Using the sampling method, select markets and merchants of different business categories such as clothing, fabrics, home textiles and small commodities across the country, and fill in the manager’s prosperity index questionnaire and the merchant’s prosperity index questionnaire respectively.
Monitoring samples
The sample of managers’ prosperity consists of 31 specialized textile and clothing markets, including Guangzhou Baima Clothing Market, Shandong Jimo Clothing Market, Jiangsu Dieshiqiao Home Textile Market, Shanghai Xinqipu Clothing Market, and Liaoning Xiliu Clothing Market. The business climate sample consists of 147 merchants including Taotao Clothing, Suntory Textile, Well Born Home Textile, and Victoria Cashmere.
Monitoring cycle
The business climate monitoring cycle is based on a monthly basis, which is submitted at the end of each month and released to the public at the beginning of the next month.
Index composition
In the “Prosperity Index of the Textile and Apparel Professional Market”, the “manager index” is composed of four first-level indexes: the manager’s prosperity index in the current period, the manager’s prosperity index in the next period, the business environment index in the current period, and the business environment index in the next period; The “manager prosperity index” is composed of six secondary indexes: total business index, logistics shipment volume index, passenger flow index, door opening rate index, rent index, and e-commerce sales index.
The “merchant index” consists of four first-level indexes: the current merchant prosperity index, the next merchant prosperity index, the current business environment index, and the next business environment index; the “current merchant prosperity index” consists of sales volume index, average selling price index, Profit index, comprehensive cost index, inventory index, and e-commerce sales index are composed of six secondary indexes.
Index analysis
The positive index includes the manager’s total business index, logistics shipment volume index, passenger flow index, merchant opening rate index, rent index, e-commerce sales ratio index and merchant sales index, average selling price index, profit index, e-commerce sales share index. A positive index exceeding 50 indicates that the operating conditions are optimistic, and the larger the value is, the more optimistic it is; the positive index is less than 50, indicating that the operating conditions are not optimistic; the smaller the value, the more pessimistic.
The reverse index includes merchant cost index and inventory index. If the cost index exceeds 50, it means that the cost pressure of merchants decreases, and the larger the value, the lower the cost pressure; if the cost index is lower than 50, it means that the cost pressure of merchants increases, and the smaller the value, the greater the cost pressure. If the inventory index exceeds 50, it means that the merchant’s inventory pressure is reduced.


